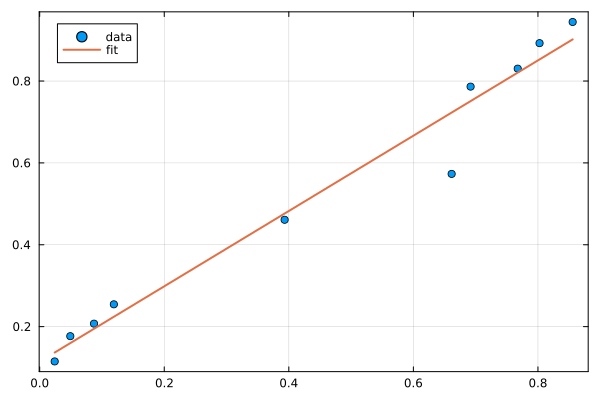
Linear fit
To perform a linear fitting, use the fitlinear function:
using EasyFit, Plots, Random
Random.seed!(1)

x = sort(rand(10))
y = sort(rand(10)) # some data

fit = fitlinear(x, y)
------------------- Linear Fit -------------
Equation: y = ax + b
With: a = 0.9199953973351944 ± 0.0582324126916642
b = 0.11453461381969128 ± 0.03221807249002226
Correlation coefficient, R² = 0.9689439025845495
Average square residue = 0.002927284812053501
Predicted Y: ypred = [0.13670126860422172, 0.15977246387454747, ...]
residues = [0.02176597097552302, -0.01685262393829734, ...]
--------------------------------------------
The fit data structure which comes out of fitlinear contains the output data with the same names as shown in the above output:
fit.a, fit.sd_a(0.9199953973351944, 0.0582324126916642)fit.b, fit.sd_b(0.11453461381969128, 0.03221807249002226)fit.R20.9689439025845495The fit.x and fit.y vectors can be used for plotting the results, together with the original data:
scatter(x, y, label="data", framestyle=:box)
plot!(fit.x, fit.y, label="fit", linewidth=2)