Density function
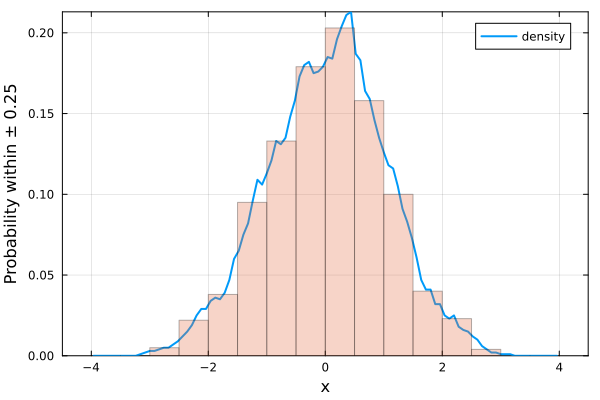
Use fitdensity to obtain the density function (continuous histogram) of a data set x.
Options are the step size (step) and the normalization type: probability by default (norm=1), or number of data points (norm=0).
using EasyFit, Plots, Random
Random.seed!(1)

x = randn(1000)

density = fitdensity(x, vmin=-4, vmax=4, step=0.5, norm=1)
------------------- Density -------------
Fields:
`x` contains the bin centers of the density function
`d` contains the probability of finding data points within x ± 0.25
-----------------------------------------plot(density.x, density.d, linewidth=2, label="density", ylabel="Probability within ± 0.25", framestyle=:box)
# Compare with the discrete histogram - the probabilities at the bin centers match
histogram!(x, xlabel="x", label="", alpha=0.3, bins=-4:0.5:4, normalize=:probability)