Some tips to produce beautiful plots with Plots and LaTeX
When using Plots, in particular in combination with the LaTeXStrings package, some tips can help one to obtain nice-looking fonts.
- Use
LaTeXStringsto produce subscripts, math, etc. - Set all fonts to
ComputerModernby default. - Adjust plot size.
LaTeX fonts
Some other options, as linewidth, framestyle, are a matter of taste. Here I use what I usually prefer.
using Plots
using LaTeXStrings
plot_font = "Computer Modern"
default(
    fontfamily=plot_font,
    linewidth=2,
    framestyle=:box,
    label=nothing,
    grid=false
)
plot(sort(rand(10)),sort(rand(10)),label="Legend")
plot!(xlabel=L"\textrm{Standard~text}(r) / \mathrm{cm^3}")
plot!(ylabel="Same font as everything")
annotate!(0.5,0.8,text("My note",plot_font,12))
This will produce a figure with homogeneous fonts:
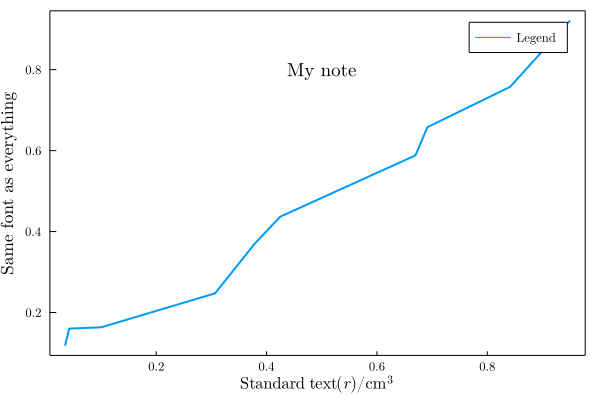
The font of annotations must be set explicitly, as in the example, for each annotation (they do not inherit the default font).
The use of \textrm or \mathrm, which should provide the same results, must be tested, because of an an issue with TeX rendering by GR. Also, sometimes it is necessary to add ~ to represent spaces in \textrm{} blocks, as in the example.
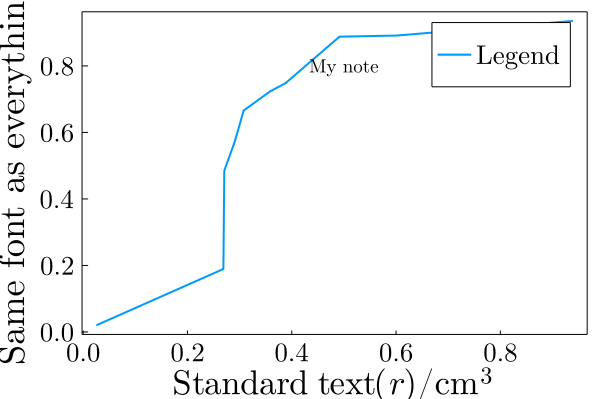
Font, margin, and figure size
The font and figure sizes can be tunned using some parameters, for instance, scalefontsizes:
scalefontsizes(1.3)
plot(sort(rand(10)),sort(rand(10)),label="Legend")
plot!(xlabel=L"\textrm{Standard~text}(r) / \mathrm{cm^3}")
plot!(ylabel="Same font as everything")
annotate!(0.5,0.8,text("My note",plot_font,12))
Which will produce this figure:
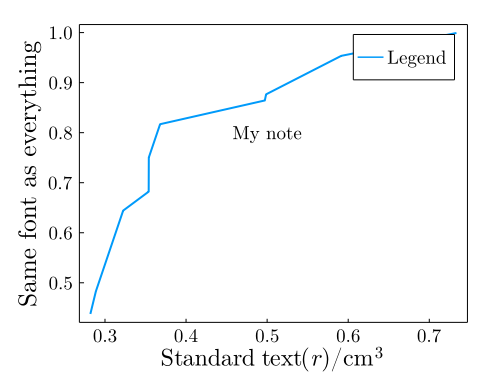
To control the margins, because sometimes depending on the font and figure sizes the labels might be cut, set margins (as in the example), which to be set practically need the explicit import of Plots.Measures, and perhaps play a little with the size (size parameter) of the figure. For example:
using Plots, Plots.Measures, LaTeXStrings
plot_font = "Computer Modern"
default(
    fontfamily=plot_font,
    linewidth=2,
    framestyle=:box,
    label=nothing,
    grid=false
)
scalefontsizes(1.5)
plot(sort(rand(10)),sort(rand(10)),label="Legend")
plot!(xlabel=L"\textrm{Standard~text}(r) / \mathrm{cm^3}")
plot!(ylabel="Same font as everything")
annotate!(0.5,0.8,text("My note",plot_font,12))
plot!(margin=(5mm),size=(500,400))
will produce:
Save as PDF, convert afterwards
As a reasonable strategy, it is practical to save the plot to a pdf file, with
savefig("./plot.pdf")and convert it later to other formats (png, tiff, etc), with, for example GIMP. PDF are scalable vector graphics, thus the resolution will be defined only on the conversion step. Additionally, PDF viewers update the file when it is modified, thus one can tune the figure properties by changing the plot generation and viewing the PDF directly, which we will be sure will conform the final figure appearance.