Moving averages
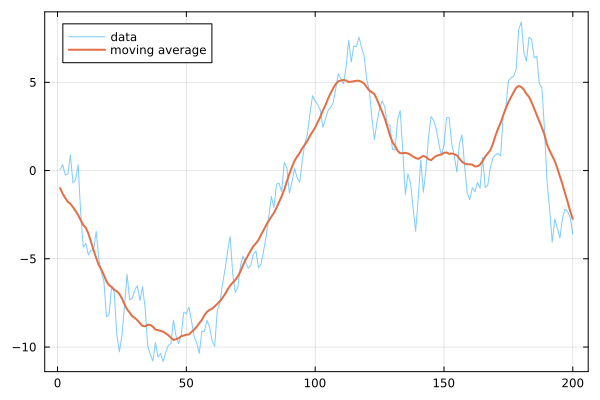
Use the movavg (or movingaverage) function. It computes the moving average of x[i] in the range i ± (n-1)/2 (if n is even, n ← n + 1):
using EasyFit, Plots, Random
Random.seed!(1)

x = cumsum(randn(200))

ma = movavg(x, 21)
------------------- Moving Average ----------
Number of points averaged: 21 (± 10 points.
Correlation coefficient, R² = 0.953995946795095
Averaged X: x = [-0.9980390809210724, -1.313089567047511, ...]
residues = [1.0599718212351525, 1.6534281215255913, ...]
--------------------------------------------
plot(x, label="data", framestyle=:box, alpha=0.5)
plot!(ma.x, label="moving average", linewidth=2)