Glycerol/water mixture
This example illustrates the use of ComplexMixtures.jl to study the solution structure of a crowded (1:1 molar fraction) solution of glycerol in water. Here, we compute the distribution function and atomic contributions associated to the inter-species interactions (water-glycerol) and the glycerol-glycerol auto-correlation function. This example aims to illustrate how to obtain a detailed molecular picture of the solvation structures in an homogeneous mixture.
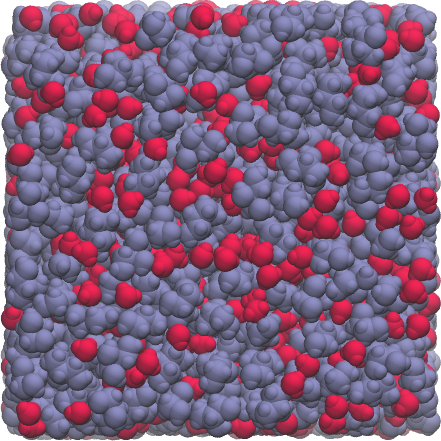
The system simulated consists of 1000 water molecules (red) and 1000 glycerol molecules (purple).
Index
- Data, packages, and execution
- Glycerol-Glycerol and Water-Glycerol distribution functions
- Glycerol group contributions to MDDFs
- 2D map of group contributions
- 3D density map of water around glycerol
Data, packages, and execution
The files required to run this example are available at [this link], and are:
equilibrated.pdb: The PDB file of the complete system.traj_Glyc.dcd: Trajectory file. This is a 200Mb file, necessary for running from scratch the calculations.
To run the scripts, we suggest the following procedure:
- Create a directory, for example
example4. - Unzip and copy the required data files above to this directory.
- Launch
juliain that directory: activate the directory environment, and install the required packages. This launching Julia and executing:import Pkg Pkg.activate(".") Pkg.add(["ComplexMixtures", "PDBTools", "Plots", "LaTeXStrings", "EasyFit"]) exit() - Copy the code of each script in to a file, and execute with:
Alternatively (and perhaps preferably), copy line by line the content of the script into the Julia REPL, to follow each step of the calculation.julia -t auto script.jl
Glycerol-Glycerol and Water-Glycerol distribution functions
The first and most simple analysis is the computation of the minimum-distance distribution functions between the components of the solution. In this example we focus on the distributions of the two components relative to the glycerol molecules. Thus, we display the glycerol auto-correlation function, and the water-glycerol correlation function in the first panel of the figure below. The second panel displays the KB integrals of the two components computed from each of these distributions.
Complete example code: click here!
import Pkg;
Pkg.activate(".");

using PDBTools
using ComplexMixtures
using Plots
using LaTeXStrings

# Load a PDB file of the system
system = read_pdb("./equilibrated.pdb")

# The full trajectory file is available at:
# https://www.dropbox.com/scl/fi/ag7k2d7i9d7ivbd5zmtl9/traj_Glyc.dcd?rlkey=93i31a5ytlzb34ulzjz315eyq&dl=0
trajectory_file = "./traj_Glyc.dcd"

# Select the atoms corresponding to glycerol and water (using PDBTools)
glyc = select(system, "resname GLLM")
water = select(system, "water")

# Compute Glycerol-Glycerol auto correlation mddf: first we initialize the
# AtomSelection object, informing the number of atoms per molecule of Glycerol
glyc_selection = AtomSelection(glyc, natomspermol=14)

# We define a large solute domain (large cutoff) to obtain a good convergence
# for the KB integral. The mddf converges at much shorter distances.
options = Options(cutoff=25.0)
mddf_glyc = mddf(trajectory_file, glyc_selection, options)

# Save results for later analysis
save("./mddf_glyc.json", mddf_glyc)

# Compute water-glycerol mddf: glyc_selection is the solute, and water is the solvent
solvent = AtomSelection(water, natomspermol=3)
mddf_glyc_water = mddf(trajectory_file, glyc_selection, solvent, options)

# Save results for later analysis
save("./mddf_glyc_water.json", mddf_glyc_water)

#
# Plot the MDDFs
#
Plots.default(
    fontfamily="Computer Modern",
    linewidth=2,
    framestyle=:box,
    grid=false,
    label=nothing,
)
scalefontsizes();
scalefontsizes(1.3)
plot(layout=(2, 1))

# glycerol-glycerol auto correlation
plot!(mddf_glyc.d, mddf_glyc.mddf, label="Glycerol-Glycerol", subplot=1)

# water-glycerol correlation
plot!(mddf_glyc_water.d, mddf_glyc_water.mddf, label="Glycerol-Water", subplot=1)
plot!(ylabel="MDDF", xlim=(1.5, 8), subplot=1)

# plot KB integrals
plot!(
    mddf_glyc_water.d,
    [ mddf_glyc.kb mddf_glyc_water.kb ],
    xlabel=L"\textrm{Distance / \AA}",
    ylabel=L"\textrm{KB~/~cm^3~mol^{-1}}",
    xlim=(0, 20),
    subplot=2
)

# Save plot
savefig("./mddf_kb.png")
println("Plot saved to mddf_kb.png")
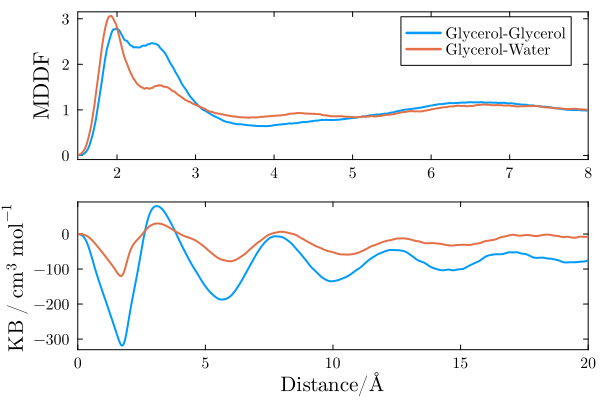
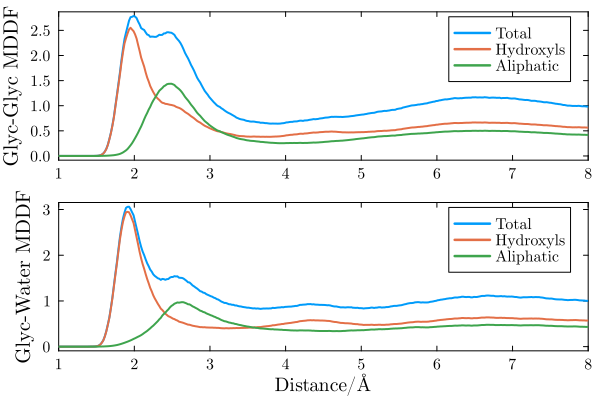
Both water and glycerol form hydrogen bonds with (other) glycerol molecules, as indicated by the peaks at ~1.8$\mathrm{\AA}$. The auto-correlation function of glycerol shows a more marked second peak corresponding to non-specific interactions, which (as we will show) are likely associated to interactions of its aliphatic groups.
The KB integrals in the second panel show similar values for water and glycerol, with the KB integral for water being slightly greater. This means that glycerol molecules are (slightly, if the result is considered reliable) preferentially hydrated from a macroscopic standpoint.
Glycerol group contributions to MDDFs
Complete example code: click here!
import Pkg;
Pkg.activate(".");

using PDBTools
using ComplexMixtures
using Plots
using LaTeXStrings

# Load a PDB file of the system
system = read_pdb("./equilibrated.pdb")

# Select the atoms corresponding to glycerol and water (using PDBTools)
glyc = select(system, "resname GLLM")
water = select(system, "water")

# Load previously computed mddfs
mddf_glyc = load(MDDFResult, "./mddf_glyc.json")
mddf_glyc_water = load(MDDFResult, "./mddf_glyc_water.json")

# Plot some group contributions to the MDDF. We select the atom names
# corresponding to each type of group of the glycerol molecule.
hydroxyls = ["O1", "O2", "O3", "HO1", "HO2", "HO3"]
aliphatic = ["C1", "C2", "C3", "H11", "H12", "H2", "H31", "H32"]

#
# Extract the contributions of these atoms to the MDDFs
#
# glycerol-glycerol
mddf_glyc_hydroxyls = contributions(mddf_glyc, SoluteGroup(hydroxyls))
mddf_glyc_aliphatic = contributions(mddf_glyc, SoluteGroup(aliphatic))
# glycerol-water
mddf_glyc_water_hydroxyls = contributions(mddf_glyc_water, SoluteGroup(hydroxyls))
mddf_glyc_water_aliphatic = contributions(mddf_glyc_water, SoluteGroup(aliphatic))

#
# Plot the contributions
#
Plots.default(
    fontfamily="Computer Modern",
    linewidth=2,
    framestyle=:box,
    grid=false,
    label=nothing,
)
scalefontsizes();
scalefontsizes(1.2)
plot(layout=(2, 1))

#
# Group contributions to glycerol-glycerol auto correlation
#
plot!(mddf_glyc.d, mddf_glyc.mddf, label="Total", subplot=1)
plot!(mddf_glyc.d, mddf_glyc_hydroxyls, label="Hydroxyls", subplot=1)
plot!(mddf_glyc.d, mddf_glyc_aliphatic, label="Aliphatic", subplot=1)

#
# Group contributions to glycerol-water correlation
#
plot!(mddf_glyc_water.d, mddf_glyc_water.mddf, label="Total", subplot=2)
plot!(mddf_glyc_water.d, mddf_glyc_water_hydroxyls, label="Hydroxyls", subplot=2)
plot!(mddf_glyc_water.d, mddf_glyc_water_aliphatic, label="Aliphatic", subplot=2)

# plot settings
plot!(ylabel="Glyc-Glyc MDDF", xlim=(1.0, 8.0), subplot=1)
plot!(ylabel="Glyc-Water MDDF", xlim=(1.0, 8.0), subplot=2)
plot!(xlabel=L"\mathrm{Distance / \AA}", subplot=2)

# Save figure
savefig("./mddf_group_contributions.png")
println("Plot saved to mddf_group_contributions.png")
2D map of group contributions
The above distributions can be split into the contributions of each glycerol chemical group. The 2D maps below display this decomposition.
Complete example code: click here!
import Pkg;
Pkg.activate(".");

using PDBTools
using ComplexMixtures
using Plots
using LaTeXStrings

# Load a PDB file of the system
system = read_pdb("./equilibrated.pdb")

# Select the atoms corresponding to glycerol and water (using PDBTools)
glyc = select(system, "resname GLLM")
water = select(system, "water")

# Load previously computed mddfs
mddf_glyc = load(MDDFResult, "./mddf_glyc.json")
mddf_glyc_water = load(MDDFResult, "./mddf_glyc_water.json")

# 2D maps plot of group contributions

# Glycerol groups
groups = (
    "OH" => ["O1", "HO1"], # first hydroxyl
    "CH_2" => ["C1", "H11", "H12"], # first CH2
    "OH" => ["O2", "HO2"], # second hydroxyl
    "CH" => ["C2", "H2"], # CH
    "CH_2" => ["C3", "H31", "H32"], # second CH2
    "OH" => ["O3", "HO3"] # third hydroxyl
)
labels = latexstring.("\\textrm{$name}" for (name, atoms) in groups)

#
# Contributions to Glycerol-Glycerol autocorrelation
# First, create a vector of vectors, in which each component carries the
# contributions of each Glycerol group to the MDDF
#
group_contrib = Vector{Float64}[] # empty vector of vectors
for (name, atoms) in groups
    push!(group_contrib, contributions(mddf_glyc, SolventGroup(atoms)))
end

# Convert output to a matrix to plot a 2D map
group_contrib = stack(group_contrib)

# The distance range to plot
idmin = findfirst(d -> d > 1.5, mddf_glyc.d)
idmax = findfirst(d -> d > 3.0, mddf_glyc.d)

#
# plot the map
#
Plots.default(
    fontfamily="Computer Modern",
    linewidth=2,
    framestyle=:box,
    grid=false,
    label=nothing,
)
scalefontsizes();
scalefontsizes(1.3)

plot(layout=(2, 1))

# map of contributions to the Glycerol-Glycerol autocorrelation
contourf!(
    1:length(groups),
    mddf_glyc.d[idmin:idmax],
    group_contrib[idmin:idmax, :],
    color=cgrad(:tempo), linewidth=1, linecolor=:black,
    colorbar=:none, levels=5,
    xticks=(1:length(groups), labels), xrotation=60,
    ylabel=L"r/\AA",
    subplot=1
)

# Water-glycerol interactions (Glycerol contributions)
group_contrib = Vector{Float64}[] # empty vector of vectors
for (name, atoms) in groups
    push!(group_contrib, contributions(mddf_glyc_water, SoluteGroup(atoms)))
end

# Convert output to a matrix to plot a 2D map
group_contrib = stack(group_contrib)

# map of the contributions of Glycerol groups to the Glycerol-Water correlation
contourf!(
    1:length(groups),
    mddf_glyc_water.d[idmin:idmax],
    group_contrib[idmin:idmax, :],
    color=cgrad(:tempo), linewidth=1, linecolor=:black,
    colorbar=:none, levels=5,
    xticks=(1:length(groups), labels), xrotation=60,
    ylabel=L"r/\AA",
    subplot=2
)
plot!(
    xlabel="Glycerol group",
    bottommargin=0.5Plots.Measures.cm,
    subplot=2
)

savefig("./GlycerolWater_map.png")
println("Plot saved to GlycerolWater_map.png")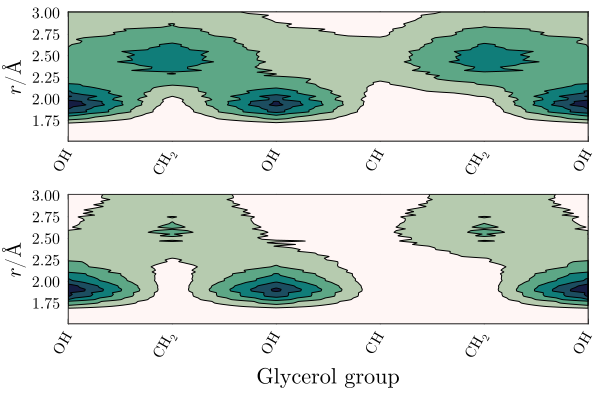
The interesting result here is that the $\mathrm{CH}$ group of glycerol is protected from both solvents. There is a strong density augmentation at the vicinity of hydroxyl groups, and the second peak of the MDDFs is clearly associated to interactions with the $\mathrm{CH_2}$ groups.
3D density map of water around glycerol
The contributions of the glycerol atoms to the MDDF of water can also be projected into the space around a glycerol molecule, with the grid3D function, and visualized with the visualize function of PDBTools (version 3.41.0 or greater). Since the solute (glycerol) is composed of many molecules, the grid is built around one of them, and the contributions of each atom are averaged over all glycerol molecules.
Complete example code: click here!
import Pkg;
Pkg.activate(".");

using PDBTools
using ComplexMixtures

# Here we will project the contributions of the glycerol atoms to the
# MDDF of water relative to glycerol into the space around one
# glycerol molecule, and visualize the density of water

# Load the PDB file of the system and the previously computed results
system = read_pdb("./equilibrated.pdb")
mddf_glyc_water = load(MDDFResult, "./mddf_glyc_water.json")

# The solute (glycerol) is composed of many molecules: the grid is built
# around one of them (the first one, by default; it can be chosen with
# the `molecule` keyword argument of grid3D). The contributions of the
# atoms are averaged over all glycerol molecules.
grid = grid3D(mddf_glyc_water, system; dmin=1.5, dmax=3.5)
glycerol = system[mddf_glyc_water.solute.indices[1:14]] # first molecule

# Regions associated with the hydrogen-bonding peak of the MDDF (d < 2.0 Å),
# with at least 10% of the maximum contribution. The glycerol molecule is
# shown in balls and sticks, and the grid points as dots colored by their
# relative contribution, from white (zero) to red (one)
hbonds = filter(p -> occup(p) < 2.0 && beta(p) > 0.1, grid)
view_hbonds = visualize(
    glycerol => (style=:ballandstick,),
    hbonds => (
        style=:dots,
        color_by=beta.(hbonds),
        colormap=:rwb,
        color_range=(1, -1),
        opacity=0.8,
    ),
)
save("./grid_hbonds.html", view_hbonds)

# The grid is converted into volumetric data, smoothed with a Gaussian
# function of width 0.5 Å, and represented by isosurfaces. Here, the
# isosurfaces correspond to 50% (orange, transparent) and 75% (red) of
# the maximum value of the smoothed data
density = volumetric_data(grid; sigma=0.5)
dmax = maximum(density.data)
view_isosurfaces = visualize(
    glycerol => (style=:ballandstick,),
    density => (isovalue=0.5 * dmax, color="orange", opacity=0.4),
    density => (isovalue=0.75 * dmax, color="red"),
)
save("./isosurfaces.html", view_isosurfaces)

# Write the volumetric data to a file, to be visualized in other software
write_dx("./density.dx", density)
println("Views saved to grid_hbonds.html and isosurfaces.html")
Output
The script saves the views as the grid_hbonds.html and isosurfaces.html files, which can be opened in any web browser (rotate, zoom, and hover over the points to identify the glycerol atoms closest to each point).
The first view displays the regions associated with the hydrogen-bonding peak of the MDDF (distances smaller than 2.0Å), with at least 10% of the maximum contribution. The glycerol molecule is shown in balls and sticks, and the grid points as dots, colored from white to red according to their contribution to the MDDF:
In the second view, the grid is converted into volumetric data with the volumetric_data function, and smoothed with a Gaussian function of width sigma=0.5 Å. The isosurfaces correspond to 50% (orange, transparent) and 75% (red) of the maximum value of the smoothed data:
The highest densities of water (red) are found at hydrogen-bonding distances from the hydroxyl groups of glycerol. The volumetric data is also written to the density.dx file (OpenDX format), which can be visualized in other software, such as VMD.
References
The interactive 3D views were rendered with 3Dmol.js, through the visualize function of PDBTools: N. Rego and D. Koes, 3Dmol.js: molecular visualization with WebGL, Bioinformatics 31, 1322-1324 (2015). https://doi.org/10.1093/bioinformatics/btu829